SalesHive
Making Ecommerce Analytics Accessible
SalesHive started with a simple observation: small e-commerce owners are drowning in data they can't use. This conceptual project explores how we might make analytics actually useful for people who don't have time to become data experts.
The Problem
Here's something I noticed: every e-commerce platform tells small business owners they need to be "data-driven," but their analytics tools might as well be written in hieroglyphics. The dashboards are powerful, sure, but they're designed for data analysts, not store owners trying to grow their business.
That's where SalesHive came in - not just another analytics dashboard, but a complete rethinking of how we present data to people who actually need to use it.
My Approach
My research showed a clear pattern: business owners know their data holds valuable insights, but they're too busy running their stores to become part-time data scientists. They don't need more metrics - they need meaningful answers.
I started by stripping away the complexity. Instead of overwhelming users with every possible data point, I designed around three questions I heard repeatedly:
"Is my business healthy right now?"
"What needs my attention today?"
"Where are my best opportunities for growth?"
Design Decisions
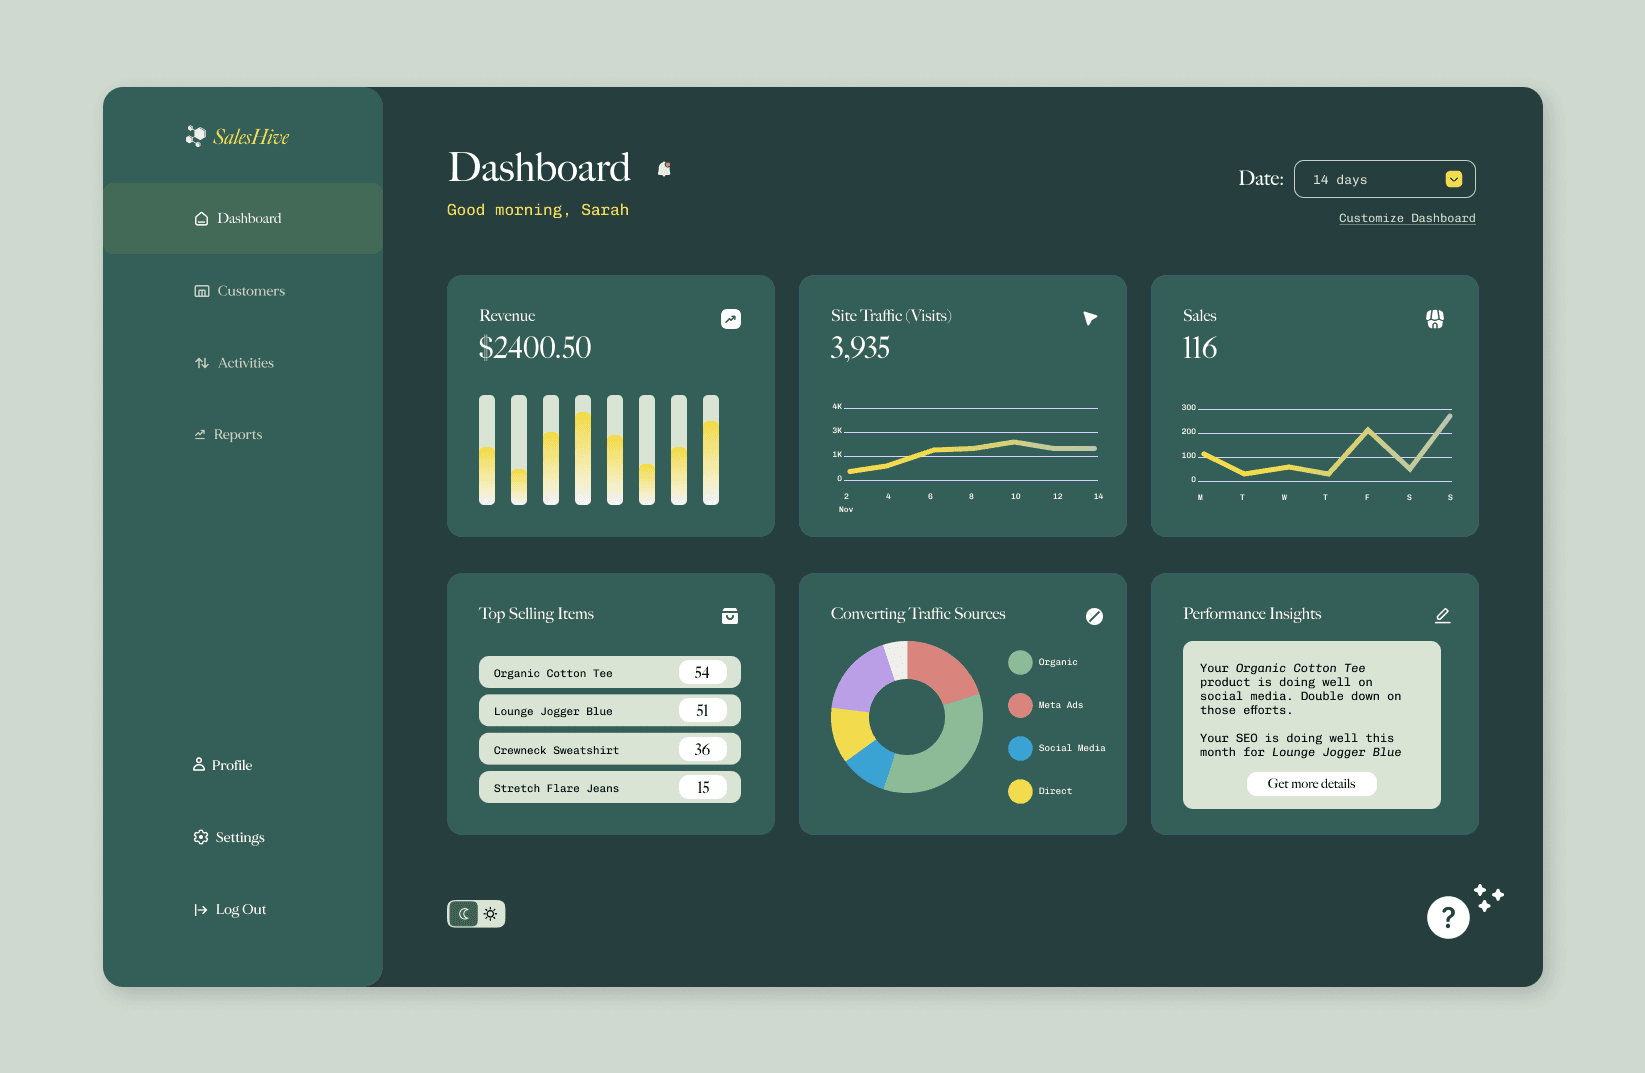
The breakthrough came when I stopped thinking about analytics and started thinking about conversations. What if checking your metrics felt as natural as asking a knowledgeable friend for advice?
This led to three key features that work together:
A dashboard that highlights what matters most right now
An AI assistant that explains trends in plain language
Clear visualizations that point to specific actions
The Impact
By focusing on clarity over complexity, SalesHive will transform how store owners interact with their data. No more switching between multiple tabs or puzzling over terminology - just clear insights that help make better business decisions.


